1 Day 1 (June 1)
1.2 Course format
- Previous course reflections and changes
- My philosophy and what I can offer
- Is the course right for you?
- How to learn statistics?
- How to spend your time?
- A prediction about the future
- Course design
- Phase 1-Crash course in spatio-temporal statistics
- Standard lectures with a good amount of reading
- Finish early july
- Phase 2-Problem based learning and advanced topics
- Phase 2 is designed to mimic research
- Tour of more advanced methods that fit within the “regression and ANOVA tool box such as neural networks.
- Phase 1-Crash course in spatio-temporal statistics
- Grades?!
- Bi-weekly journal (40%)
- Assignments (20%)
- Final project (40%)
- How to best interact with me
- Depends on your career path
- Easy to access online once we are established
- Please make good use of our time (e.g., zoom vs. in-person)
- How to best interact with students in this class
- Huge diversity of majors and professions
- Huge diversity of skills
- A comment about your KSU degree and amount of statistics
- Who is in this class?
url <- "https://www.dropbox.com/scl/fi/x8ser8egns2j1cvqj3jxd/students_STAT_705_B.csv?rlkey=fvucxdwyv2wxz08mnz0ioovjq&dl=1"
df <- read.csv(url)

par(mar=c(13,2,2,2))
plot(rev(sort(table(df$degreeProgram))),las=2,xlab="",ylab="Number of students",ylim=c(0,5))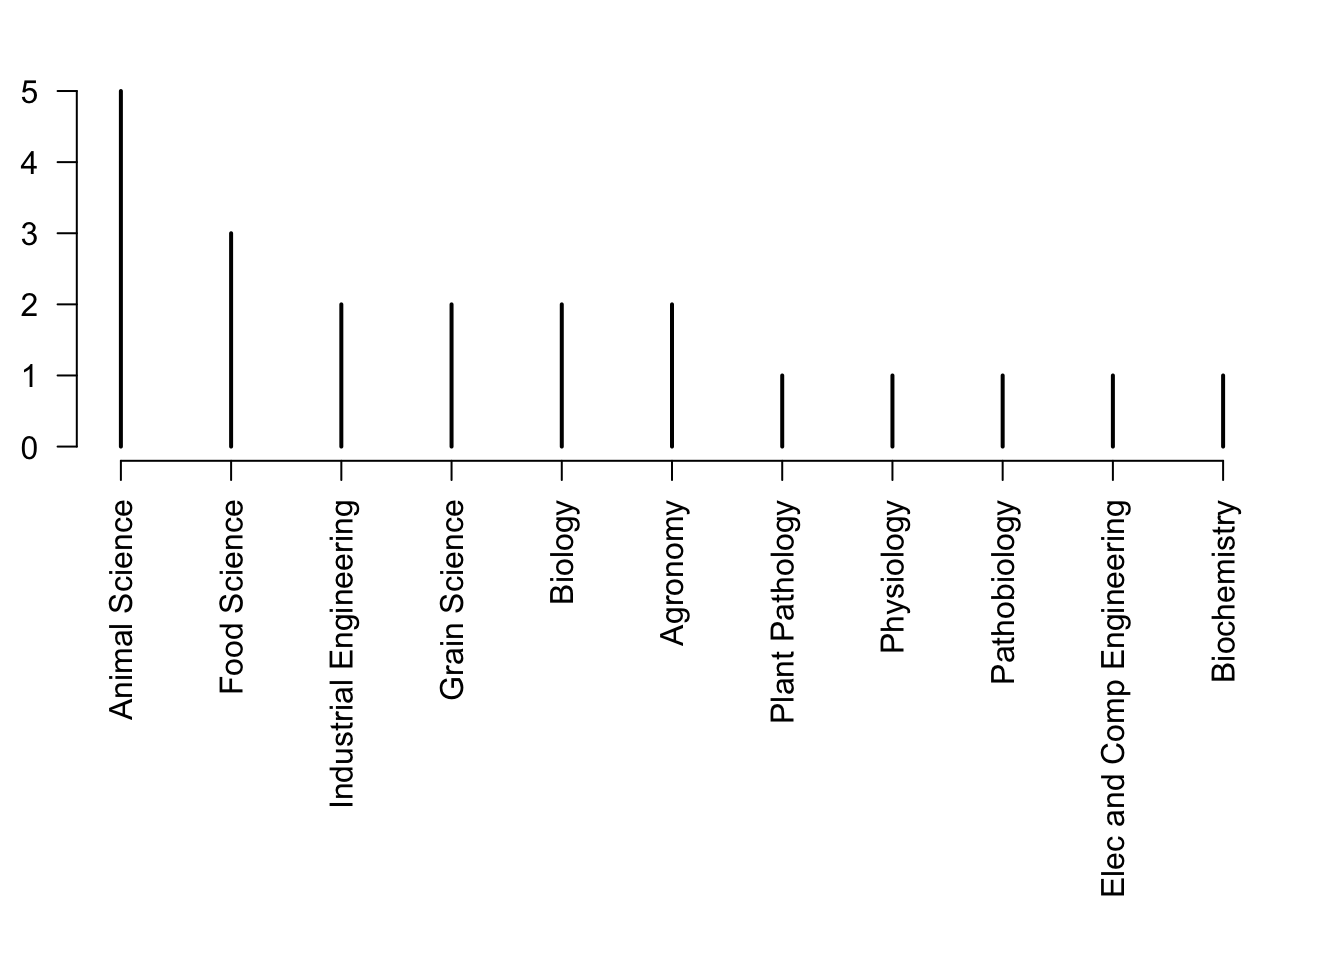
1.3 First journal
- On our first journal assignment (due 6/2/26 at 11:30 am), please include a paragraph or more about your background/history with statistics. You can include this paragraph in the “is there anything else you would like me to know” section.
1.4 Intro to statistical modelling
- A difficult question
- “How much money will I have for retirement?”
- “Am I ruining my life now by over saving for retirement?”
- What is data?
- Something in the real world that you can, in some way, observe and measure with or without error
- What is a statistic?
- A function of the data
- What is a model?
- Mathematical models
- Statistical models