2 Day 2 (June 2)
2.1 Announcements
Second daily journal due tomorrow before class
Assignment 1 is due on Friday.
- Upload to Canvas
- Assignment should only take 15-30 min if everything works
- Do not spend more than 1 hour
- After 1 hour of trying please visit me during office hours
- Do not wait until Thursday to do the assignment
Recommended reading
- Chapters 1 and 2 (pgs 1 - 27) in Linear Models with R
Questions and comments from journal
- Some thoughts on data collection and being a graduate student
- “However, concept I would have to understand better would be different majors using the same thing. Take for instance if we are all from diverse backgrounds, how are we all able to use statics for it to be understood by everyone.”
2.2 Intro to statistical modelling: retirment example
Goal of the next few days is to get excited about statistical modeling
Discussion question: How much data do you need to do statistics?
A difficult question
- “How much money will I have for retirement?”
- “Am I ruining my life now by over saving for retirement?”
What is data?
- Something in the real world that you can, in some way, observe and measure with or without error
What is a statistic?
- A function of the data
What is a model?
- Mathematical models
- Statistical models
Back to the difficult question
- How much money will I have for retirement?
- Point prediction vs. distributional prediction
- What data/information do I have?
- What data do I need?
- How can I answer this question using a statistical model?
- How much money will I have for retirement?
Example: my retirement
- Personal information
- Obviously this isn’t my actual information, but it isn’t too far off!
- Since I am a millennial I don’t think social security will be around when I retire (i.e., assume social security contributes $0 to my retirement)
- As of 1/1/26 I have $600,000 in a 401k style retirement account
- All of money is invested into an S&P 500 index fund (VOO to be exact)
- I am 40 as of 1/1/26
- I want to know how much pre-tax money I will have at a given retirement age (e.g., 65, 70, etc)
- Example using a mathematical model
- Whiteboard demonstration
- What are the model assumptions?
- In program R
- Personal information
# The value of my 401k retirement account as of 1/1/26
y_2026 <- 600000


# How much money will I add to my 401k each year
q <- 28000


# Rate of return for S&P 500 index fund
r <- 0.08


# How much $ will I have in 2027
y_2027 <- y_2026*(1+r)+q
y_2027
## [1] 676000## [1] 758080## [1] 846726.4# Using a for loop to calculate how much $ will I have
year <- seq(2026,2026+30,by=1)
y <- matrix(,length(year),1)
rownames(y) <- year
y[1,1] <- 600000
for(t in 1:30){
y[t+1,1] <- y[t,1]*(1+r)+q
}
plot(year,y/10^6,typ="b",pch=20,col="deepskyblue",xlab="Year",ylab="Pretax retirement amount ($ millions)")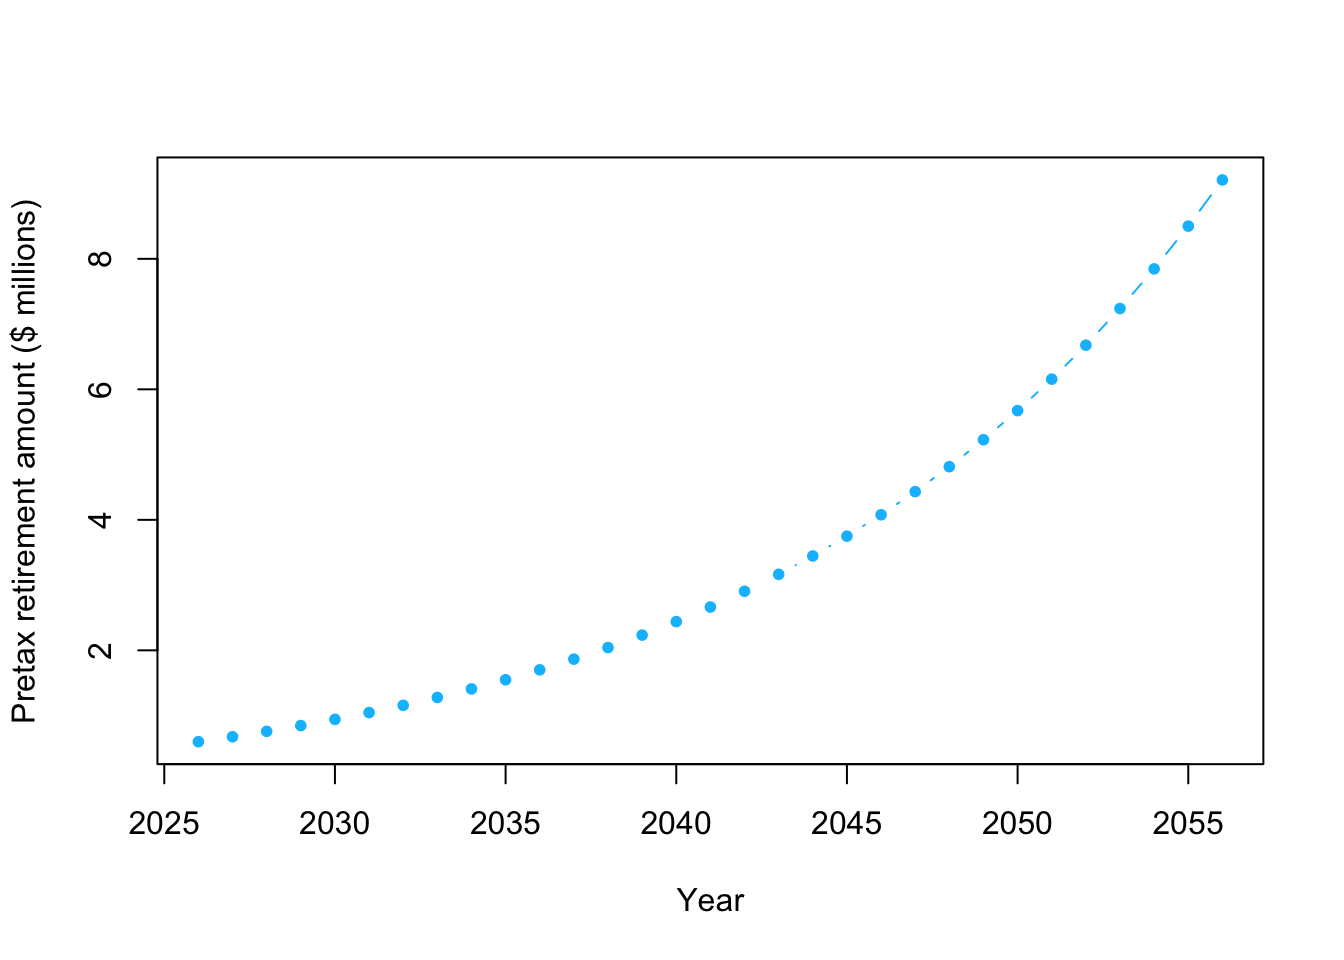
# How much $ will I have when I am 60?
# Note that units are millions of $
retirement.year <- 2026+20
y[which(year==retirement.year)]/10^6
## [1] 4.077909- Example using a Bayesian statistical model
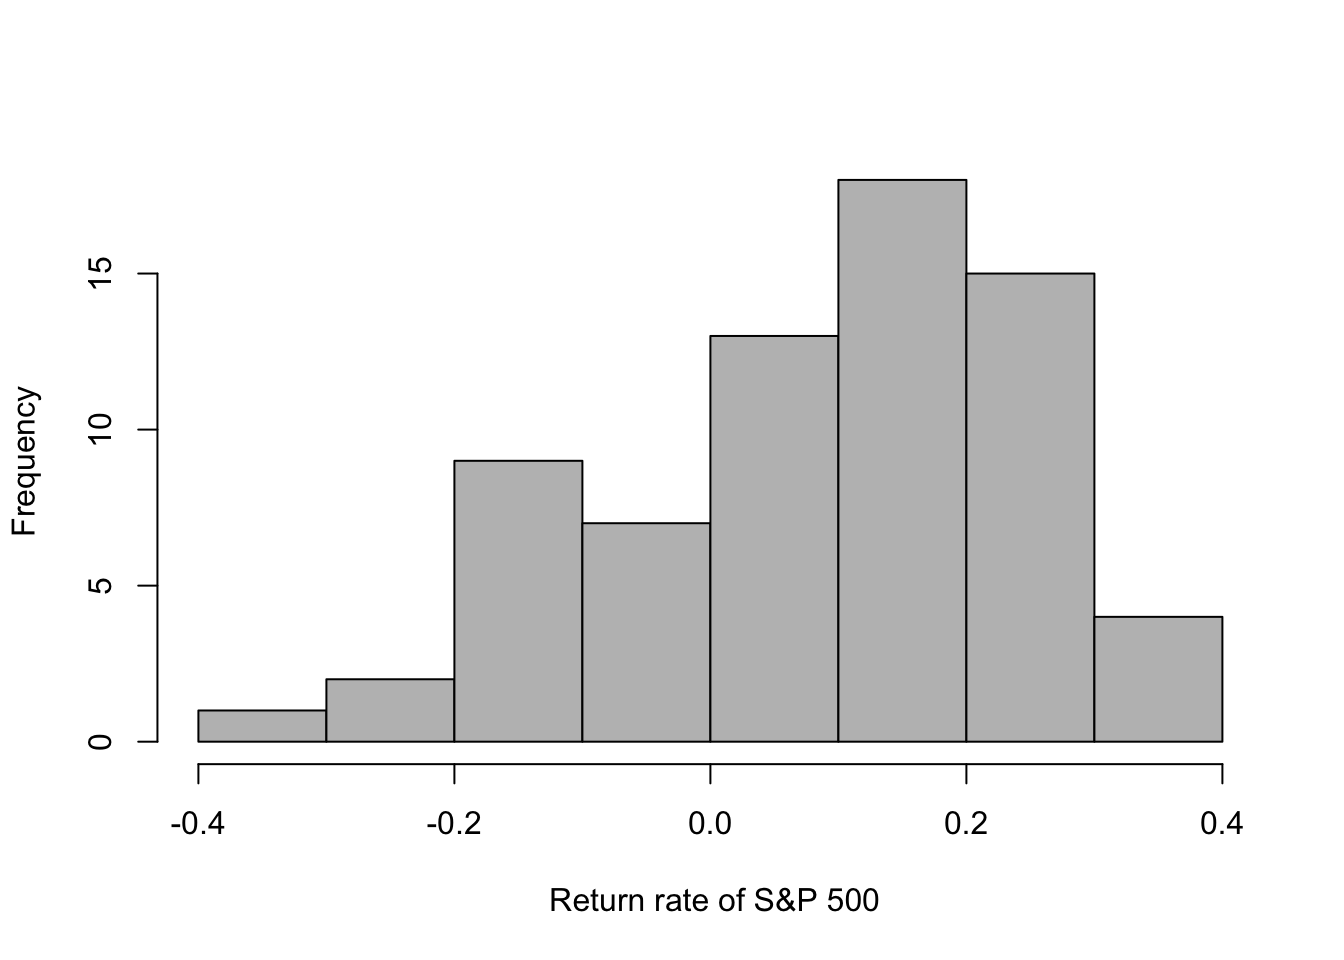
- S&P 500 return since inception in 1957
# Download S&P 500 returns
url <- "https://www.dropbox.com/scl/fi/cgnf2tt64qi4uososhdnf/chart_20260529T205422.csv?rlkey=nampviv31g3p2k39q91km3cf4&dl=1"
df.sp500 <- read.csv(url)

head(df.sp500)
## Date return
## 1 12/31/57 -0.1431
## 2 12/31/58 0.3806
## 3 12/31/59 0.0848
## 4 12/31/60 -0.0297
## 5 12/31/61 0.2313
## 6 12/31/62 -0.1181## Date return
## 64 12/31/20 0.1626
## 65 12/31/21 0.2689
## 66 12/31/22 -0.1944
## 67 12/31/23 0.2423
## 68 12/31/24 0.2331
## 69 12/31/25 0.1639## [1] 0.08838116